Process Control Charts Made Simple
Create Process Behavior Charts in Google Sheets™ with just a few clicks. No complex formulas, no manual calculations.
Why choose Easy PBC?
Pricing
Select your offer based on how many data you collect.
Free
FreeForever free
- 3 PBCs updated daily
- Easy analysis setup
- Automatic signal detection
- Easy limit changes
- Automatic analysis update
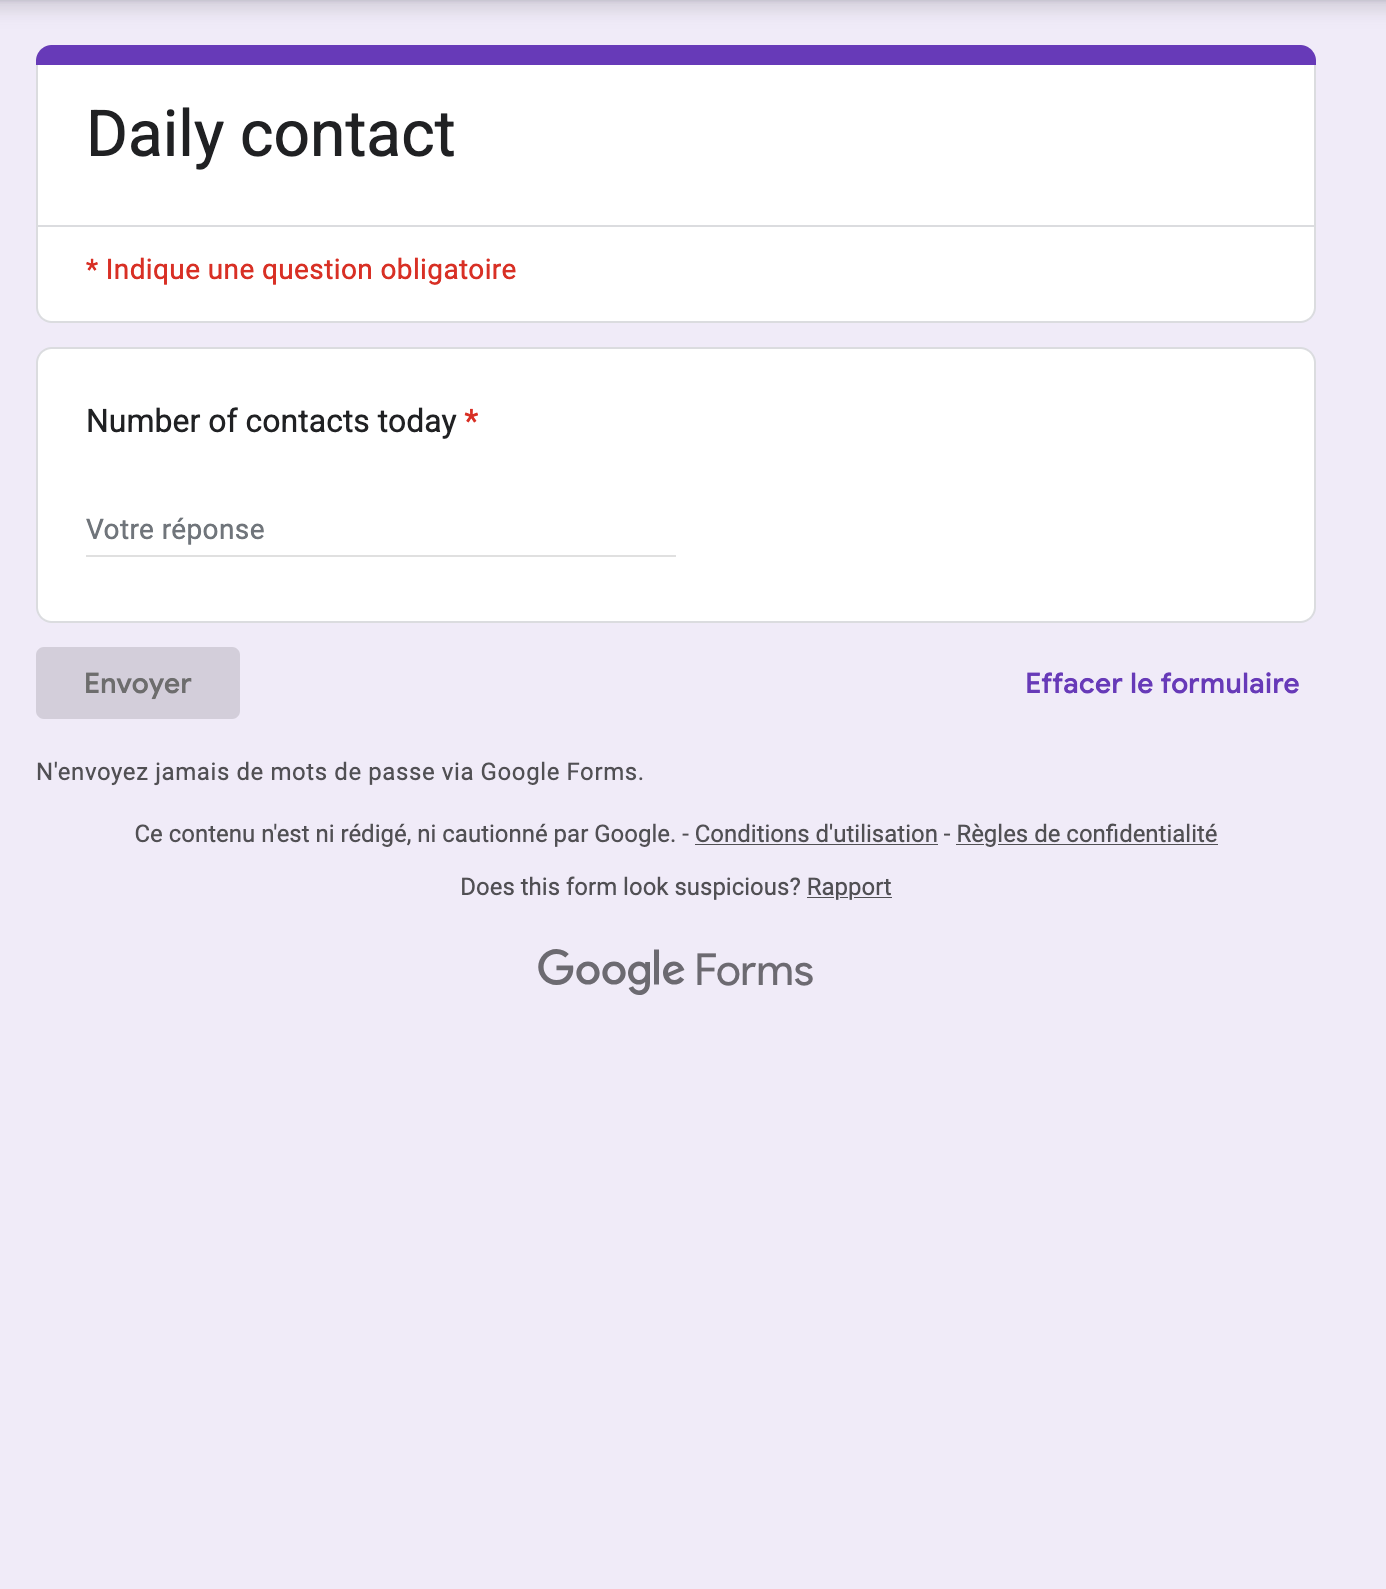
- Collect via Google Forms™
- Basic support
Most popular
Daily
Perfect for tracking data on a daily rate
- 100+ PBCs updated daily
- Easy analysis setup
- Automatic signal detection
- Easy limit changes
- Automatic analysis update
- Collect via Google Forms™
- Product support
Hourly
If you need to track data at an hourly rate
- 65+ PBCs updated hourly
- Easy analysis setup
- Automatic signal detection
- Easy limit changes
- Automatic analysis update
- Collect via Google Forms™
- Product support
Minutes & Seconds
$ ??Wow, you are super serious about being data driven !
We do not have a plan, but contact us to see what we can do together. Contact usUnderstanding Process Behavior Charts
The foundation of data-driven process improvement
What are PBCs?
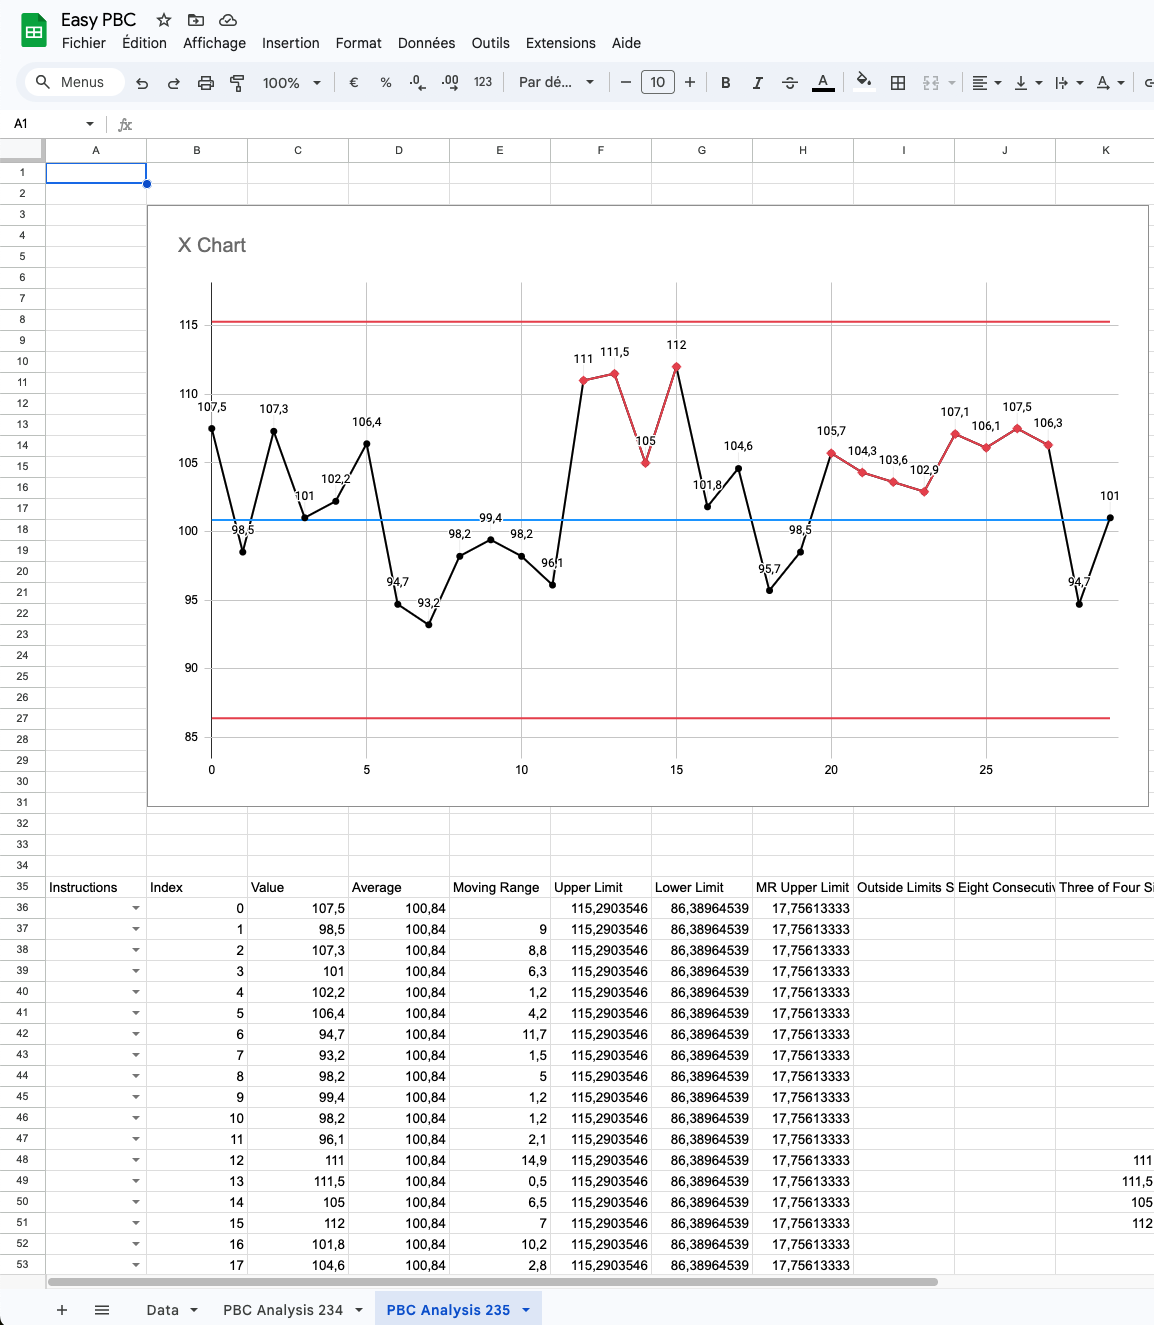
Process Behavior Charts (PBCs) are powerful visualization tools that help you understand and improve your processes. Originally developed by Walter Shewhart at Bell Laboratories in the 1920s, they are the cornerstone of Statistical Process Control (SPC).
By plotting your data over time, PBCs reveal if changes in your process are normal variations (common cause) or signals (special cause) that require attention. Unlike traditional charts, PBCs use statistical rules to identify significant patterns, helping you make data-driven decisions and avoid overreacting to random fluctuations.
PBCs consist of a time-series chart with three key elements: the centerline (process average), the upper control limit, and the lower control limit. These limits are calculated based on the natural variation in your process, not arbitrary targets.
What is Statistical Process Control?
Statistical Process Control (SPC) is a methodology that uses statistical methods to monitor and control processes. The goal of SPC is to ensure that processes operate efficiently, producing more specification-conforming products with less waste.
SPC helps you distinguish between two types of variation:
- • Common Cause Variation: The natural, expected variation inherent in any process
- • Special Cause Variation: Unexpected changes that signal something unusual is affecting your process
This distinction is crucial - reacting to common cause variation as if it were special often leads to overadjustment and increased variability (known as "tampering"), while ignoring special causes means missing opportunities for improvement.
Key Benefits of Using Process Behavior Charts
Data-Driven Decision Making
Make objective decisions based on statistical evidence rather than gut feelings or assumptions
Distinguish Signal from Noise
Identify when changes in your process require attention versus normal variation
Continuous Improvement
Provide a framework for ongoing process enhancement and performance optimization
Proactive Problem Solving
Detect issues early before they become major problems or affect customers
Process Predictability
Gain insights into future performance and make more accurate forecasts
Cost Reduction
Minimize waste, rework, and unnecessary adjustments to save time and resources